Does Transparency About Training Data Change How Users Trust AI?
A two-study design research project that introduced data-centric explanations, a new transparency format for everyday users, and tested how they shape trust and fairness perceptions across a range of AI scenarios.
How does making an AI’s training data visible affect the way everyday users trust and assess it?
Two iterative studies (formative n = 17, evaluative n = 27) using a purpose-built data-centric explanation prototype.
Trust tracked data quality directly: revealing problems lowered it, revealing balanced data raised it. The effect held regardless of ML expertise.
Overview
Most AI explanations show what a model decided. This project asks what happens when people can also see what the model learned from. I designed data-centric explanations and ran two user studies to find out how training data transparency shapes trust and fairness perceptions.
Identified the research gap through literature review. Originated the concept of data-centric explanations and adapted Gebru et al.'s datasheet format into an accessible Q&A interface for everyday users.
Built the explanation prototype iteratively in Figma, from early hand-drawn sketches through two rounds of study-driven refinement to a tested high-fidelity interface.
Wrote both study protocols, designed Study 1 interview guides, obtained REB approval, and recruited and ran all 44 participants in-person across both studies.
Conducted thematic analysis on Study 1 interview transcripts and ran all statistical analyses for Study 2, including ANOVAs across trust, fairness, and comfort measures.
The Problem
XAI research has focused on model behavior and outputs. Training data, where a model's assumptions and biases originate, has been largely left out of the picture.
Model Explanations
Describe internal logic, feature weights, or decision rules of the model.
Output Explanations
Explain why a specific prediction was made for a given input.
Data-Centric Explanations
Describe the training data: its sources, composition, and characteristics.
This WorkResearch Question
How does transparency about an AI system's training data affect how users perceive and trust the system?
Methods
Semi-Structured Interviews
Used in Study 1 to explore how users interpreted and responded to training data explanations.
Thematic Analysis
Applied to Study 1 transcripts to surface themes around user sense-making of training data provenance.
Post-Task Questionnaires
Used in Study 2 to measure trust, fairness perception, and reliance intentions with validated scales.
Mixed Methods Analysis
Study 2 combined quantitative scale scores with post-study interview data to triangulate findings.
Research Process
Identifying the Gap
Existing XAI work explained decisions and model behavior. None surfaced what the model was trained on. That gap was the entry point.
Concept Development
Starting from Gebru et al.'s datasheets for ML practitioners, I adapted the format through pilot iterations into a five-category Q&A interface for everyday users.
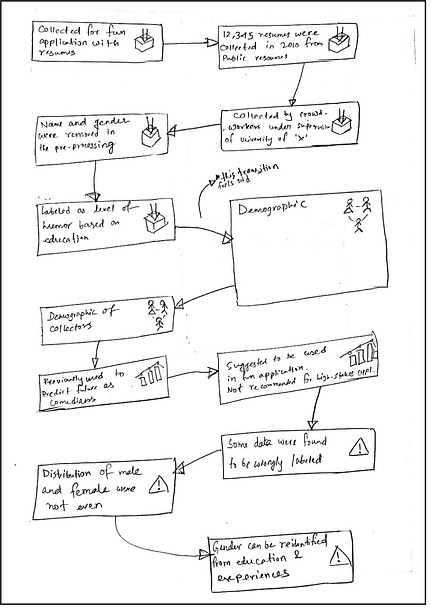
Early sketch exploring how training data information might be structured and connected.
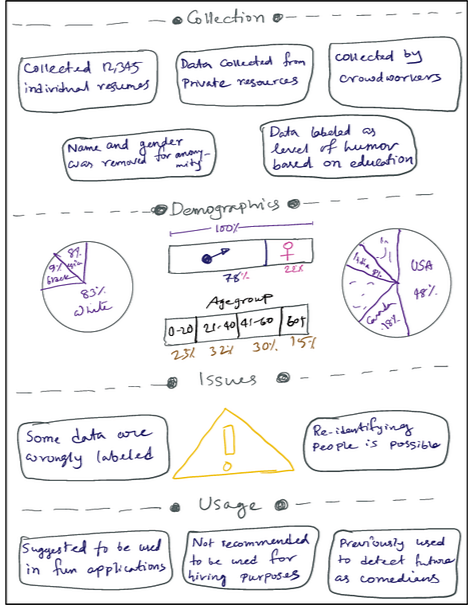
Sketching out the information categories: collection, demographics, issues, and usage.
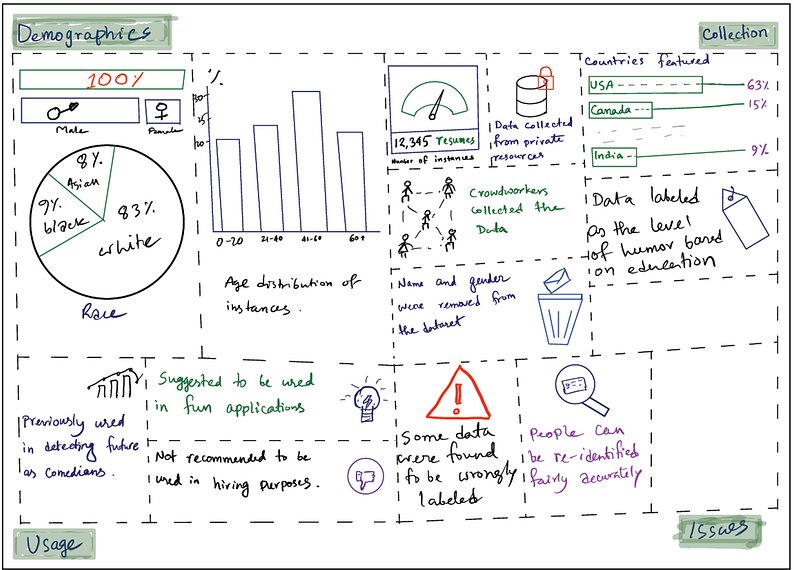
A more refined low-fidelity prototype before moving to digital prototyping.
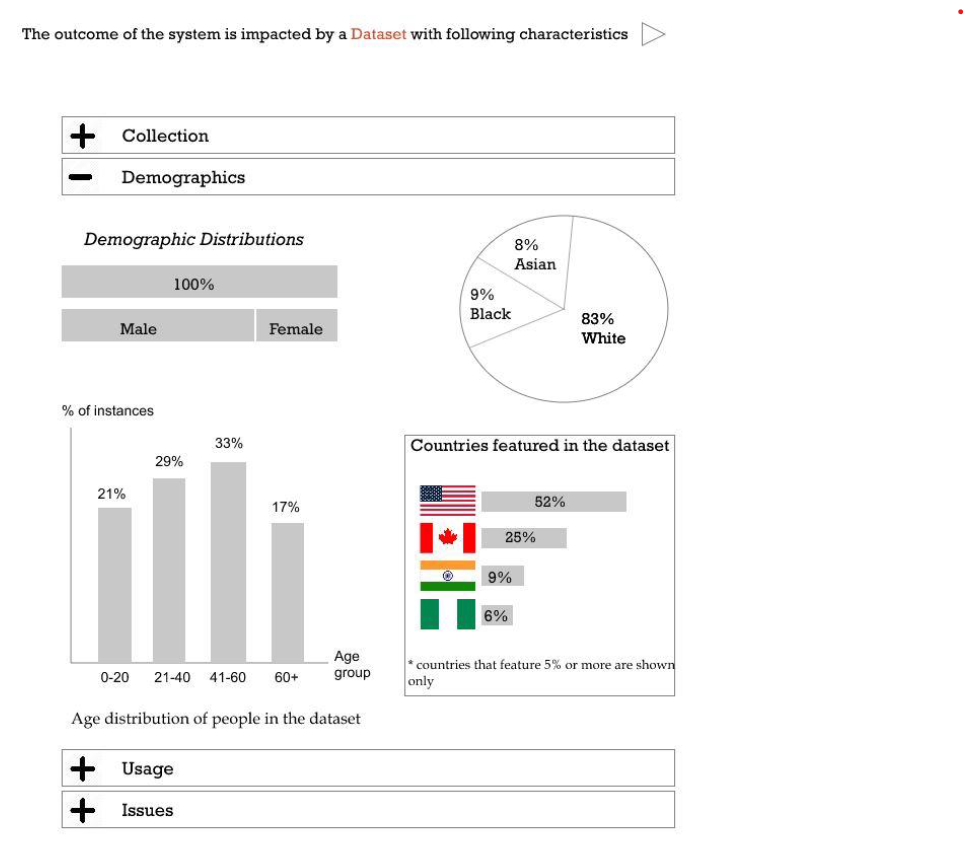
A digital low-fidelity prototype exploring the question-based presentation of training data information.
I showed an early prototype to 17 participants and interviewed them about their ML knowledge, fairness intuitions, and reactions to the format.
Universal positive reception. All 17 participants reacted positively and expressed genuine interest in knowing more about what AI systems are trained on.
A hidden transparency gap. Over half (9/17) were unaware that ML systems could exhibit fairness issues, confirming a meaningful gap that data-centric explanations can address.
Q&A gave users control. Participants appreciated navigating directly to what they cared about, rather than reading linearly through a fixed narrative.
Depth-accessibility tension. ML experts flagged interpretability concerns; some non-experts wanted more detail. Both signals drove the redesign.
- Added more depth and detail to nearly all answers in the prototype
- Removed low-utility questions (dataset creators, funding source, maintenance) based on usefulness ratings
- Refined language throughout to improve accessibility for non-expert users
Final Prototype
Study 1 feedback drove three key design decisions: a Q&A format over narrative (users wanted to control what they explored), a bar chart for demographics (users spotted imbalances visually but missed the same numbers in text), and progressive disclosure within each category to avoid first-load overwhelm.
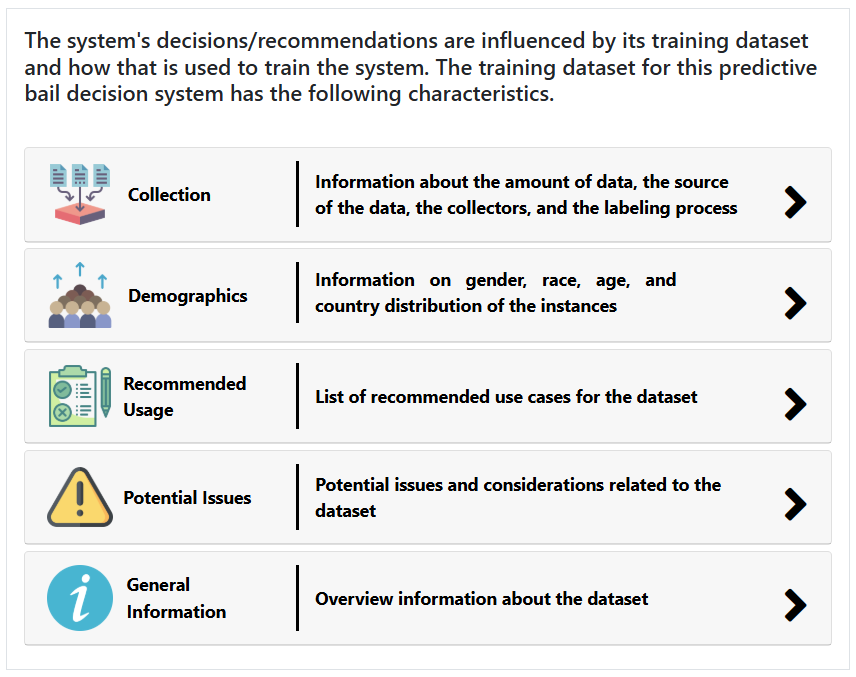
Overview: five training data categories users can explore: Collection, Demographics, Recommended Usage, Potential Issues, and General Information.
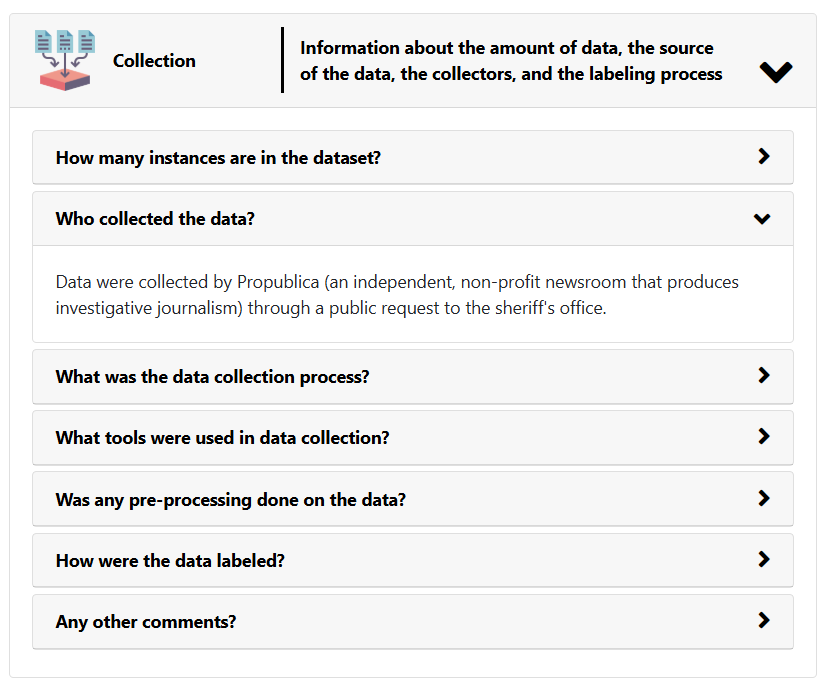
Collection: Q&A cards covering how much data was collected, where it came from, who collected it, and how labeling was done.
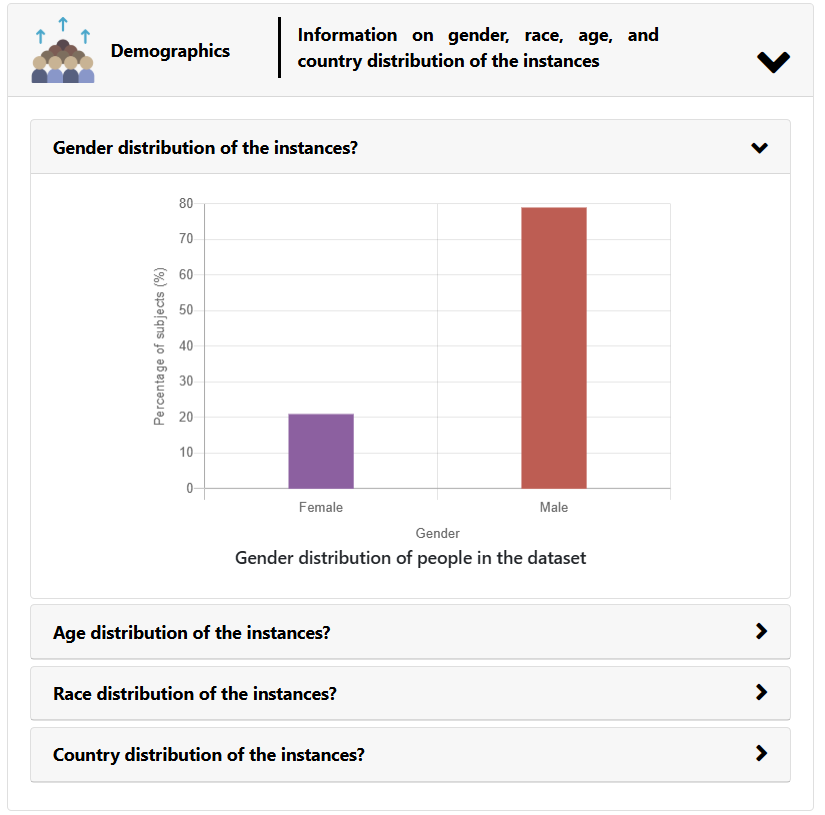
Demographics: a gender distribution bar chart (80% male, 20% female) alongside questions about age, race, and geographic distribution.
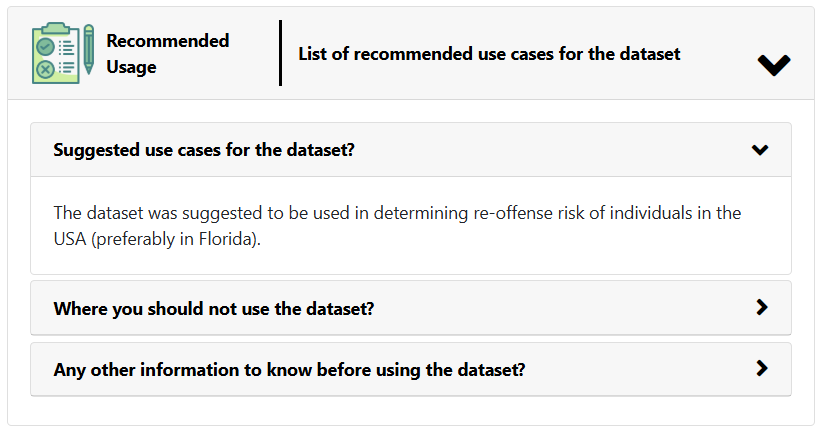
Recommended Usage: suggested use cases, contexts where the system should not be applied, and additional usage considerations.
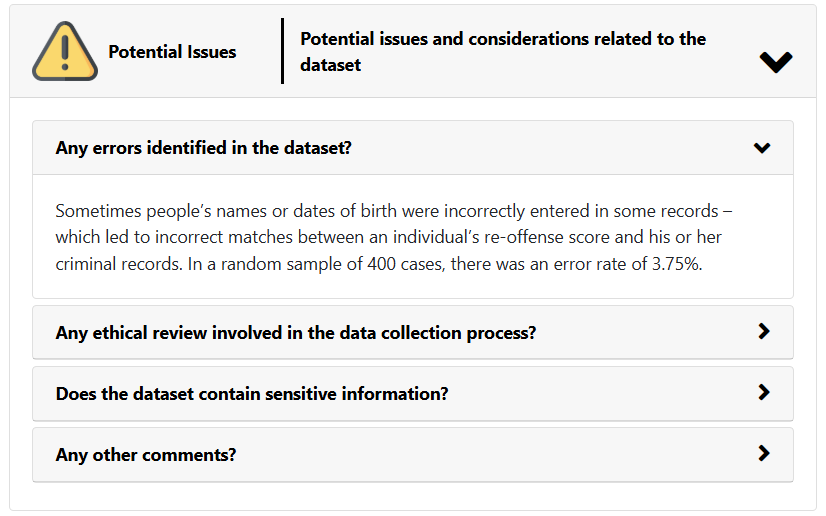
Potential Issues: known errors in the dataset (3.75% error rate), ethical review status, and whether the data contains sensitive information.
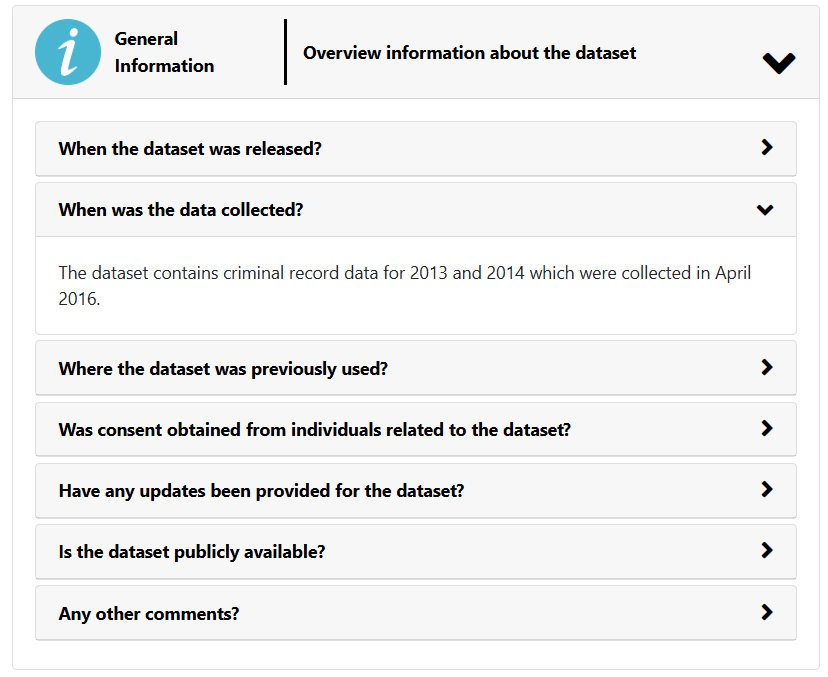
General Information: dataset release and collection dates, prior use cases, consent procedures, and public availability status.
27 participants across three expertise levels interacted with four AI scenarios: two with balanced training data, two with clear red flags. After each, they rated trust, fairness, and comfort, then completed a semi-structured interview.
Trust tracked data quality. Trust, fairness, and comfort all dropped significantly when explanations revealed red-flag training data, and rose when training data was balanced.
Demographics mattered most. Two-thirds of participants cited demographic distribution as the most influential category for assessing potential bias.
Expertise made no difference. Beginners and experts engaged with the explanations similarly; no significant effect of ML background on any measure.
Stakes shaped engagement. Participants probed explanations most carefully in high-stakes scenarios like bail and admissions, and saw less need for them in low-stakes contexts.
If I did not have the explanations, the results would seem more reliable. I would have no idea about the distribution of gender, country, and other demographics. I would have no idea how the data was collected, by whom, or by computer or manually. So, I think the explanations helped me to have a more in-depth idea about the system.Participant, Study 2
Key Insights
Transparency calibrates trust, it does not destroy it
Trust, fairness, and comfort shifted in response to data quality: down when training data had red flags, up when it was balanced. Users used the information to calibrate, not to reject.
Demographics are the keystone information
Two-thirds of participants cited demographic distribution as the single most influential category. Many spotted bias from the bar chart before reading a word. If you show one thing, show demographics.
AI expertise does not gate comprehension
No significant effect of ML background on any outcome measure. Beginners and experts engaged similarly. Training data explanations are accessible without ML expertise.
Stakes determine engagement depth
Participants probed training data most carefully in high-stakes scenarios like bail and admissions, and saw less need for it in low-stakes contexts. Design transparency features for the moments that matter most.
Design Implications
Core Insight
Transparency is not just about explaining decisions. It is about giving people the context they need to decide how much to trust those decisions in the first place. Data-centric explanations, by surfacing what a model learned from, provide exactly that context.
- Make training data a first-class transparency artifact. Users reasoned about data quality and demographics on their own terms without needing to understand a model's internals.
- Lead with demographics and collection. Two-thirds of participants cited demographics as most useful; they spotted biases from the chart before reading a single word.
- Design for calibrated trust, not maximum trust. Explanations that lowered trust by surfacing real problems were doing exactly what they should.
- Do not underestimate non-expert users. Study 2 found no significant difference between beginners and ML experts on any measure.
Impact
For product teams building AI systems: users do not need to understand how a model works to reason meaningfully about whether to trust it. They need to know what it learned from. This study showed that surfacing training data (demographics, collection method, known issues) gives users enough to form calibrated trust judgments on their own terms, without requiring ML expertise. The implication for transparency design is direct: training data deserves a UI.
Published at ACM CHI 2021. Directly motivated three follow-on studies in this portfolio.